Iron Speed Designer Help
 

Actions

Most actions are formulas where you can use any function from the extensive formulas list. See Part V: The Formula Language for details.

Property

Description

Apply to

Specifies table control filter applies to. One filter can be applied to one or more table controls. Filter can be applied only to direct children, grandchildren and so on.

Applies To

Filter controls

Chart title

Specifies an initialization formula which sets value of the text displayed above the chart.

Applies To

Chart controls

Control visible

Hides or sets control visible based on the value returned by formula.

Applies To

Most of buttons
Tab container

Display As

Specifies field or formula from the filter’s DataSource to be displayed on the QuickSelector button.

Applies To

Filter controls type of QuickSelector

Index label

Specifies field or formula from the chart’s DataSource which is displayed along the index axis or above the chart columns.

Applies To

Chart controls

Index remainder label

Specifies text displayed along the index axis at the remainder value or above the remainder column.

Applies To

Chart controls

Index title

Specifies text displayed on the side or below the index axis.

Applies To

Chart controls

Initialize

Specifies an initialization formula which sets value of the filter on initial load. By default filter is initialized to a URL parameter if it is passed.

Applies To

Filter and search controls

Initialize when adding record

Initializes user interface control when page is loaded for the new records to be added in database.

Applies To

Editable databound controls

Initialize when editing record

Initializes user interface control when page is loaded for the existing records to be updated in database.

Applies To

Editable databound controls

Initialize when showing record

Initializes user interface control when page is loaded for records to be displayed but not edited.

Applies To

Non-Editable databound controls

Populate from database

Specifies a field which is being populated from the database into this dropdown list.

Applies To

Filter controls type of dropdown list

Populate from static list

Specifies constant values to be inserted in the dropdown list such as –PLEASE SELECT—.

Applies To

Filter controls type of dropdown list
OrderSort

Redirect URL column

Enables click through the chart’s column or bar. If URL is provided redirects to the specified page and passes through URL parameters to display relevant records.

Applies To

Chart controls

Save into cookie

Saves user interface control’s value into the specified cookie. You can modify the value to be saved, for example encrypt it.

Applies To

Editable databound controls

Save into database

Saves user interface control’s value into the database field. You can modify the value to be saved, for example encrypt it.

Applies To

Editable databound controls

Save into session variable

Saves user interface control’s value into the session variable. You can modify the value to be saved, for example encrypt it.

Applies To

Editable databound controls

Value data

Specifies field or formula from the chart’s DataSource which returns a set’s value. Has to be numeric.

Applies To

Chart controls

Value title

Specifies text displayed on the side or below the value axis.

Applies To

Chart controls

Validate when saving record

Implements custom data validation when saving database record

Applies To

Editable databound controls


Example: Changing Chart Labels, Titles and Data Display with Formulas

Use the Property Sheet (Actions group) to change chart values and titles.


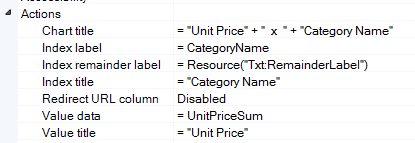
The chart title is usually a simple text string.  Labels and values sometimes may contain more complex formulas.  For example, you may show a name (text) instead of an ID value:


Only fields included in the database query are available for use.  By default, if you selected a primary key field as an index field in the Charting Wizard’s Options step, all non-binary and non-large text fields will be included in the query and are available for use.  However, if the index field is not a primary key, only the index field will be included.

You can include, change or exclude fields and aggregate functions in the Query Wizard.  Note, that adding fields potentially changes the result set because the SQL query must include a GROUP BY clause for all non-aggregate (those without functions) fields.  Accordingly, the only case when final values will not be affected is when the original index field is unique (a primary key, for example).

Formulas are useful for implementing Display As (display foreign key as) functionality.  For example, to create a chart of total sales per product category, you might want show category as category name, rather than as an ID value.  In this case, select Category / CategoryID as an index and than modify the formula.  Note, that same result set is possible to get if Products and CategoryID are selected, but in this case despite exactly same values for SUM only CategoryID field is included. So it is always a better strategy to select a primary key from the parent table instead of selecting a foreign key field in the child table for the index field.

Data formulas

Similarly you can change the data display formula.  By default, the data formula fetches data from a database query via a LOOKUP() function, but you can select different data if your query contains more than one aggregate function, and you can modify the value with arithmetic operations.  Also if you elected to show values as percentage in the Charting Wizard, the query retrieves values values and calculates percentages.

You can modify the display format of the data values, but make sure that your data’s formula always returns a numeric value.

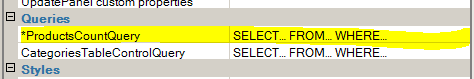
To verify which query your chart uses, look in the Queries section of the Property Sheet.

Note: when you modify your query, especially when adding or removing fields, you must ensure that any formula using the query is appropriately updated appropriately.

Using chart formulas in code customizations

These formulas are used when populating arrays of labels and values for a chart using one of the following methods:

GetComposedStringColumn(…)

GetComposedPercentageColumn(…)

GetComposedDecimalColumn(…)

For example:

Dim indexArray() As String = UnitPriceSumQuery.GetComposedStringColumn("""Employee :"" + LastName + "" "" + FirstName", EvaluateFormulaDelegate, EvaluateFormula("Resource(""Txt:RemainderLabel"")"))

Where the first string is a Formula. These calls are generated automatically but could be overridden in Set…Chart method on a Code tab for a chart.